Ivan Sheu
Data Analysis and Communication
GitHub »
LinkedIn Profile »
About Me
I'd like to share some of my work here. My career at Acumen, LLC (a public health data analysis firm) allows me to work daily with vast Medicare datasets (medical claims, provider and beneficiary enrollment databases, fraud case narratives). I put this data to use to monitor regional utilization, to devise metrics to capture specific abusive behaviors, to evaluate effects of a policy, etc.
It's been wonderful to uncover stories and to tease out structure from data. I'm excited to learn about, and busy myself learning techniques available to achieve these ends.
I'm particularly keen on exploring visualization as a narrative tool, and as a tool for experts to diagnose and evaluate their work. Many of my publishable projects on this site relate to data communication.
I've learned a lot from:
data visualization
distribution comparison tool
I developed this tool for a client whose requirements were to compare the distribution of spending for a very large number of different groups.
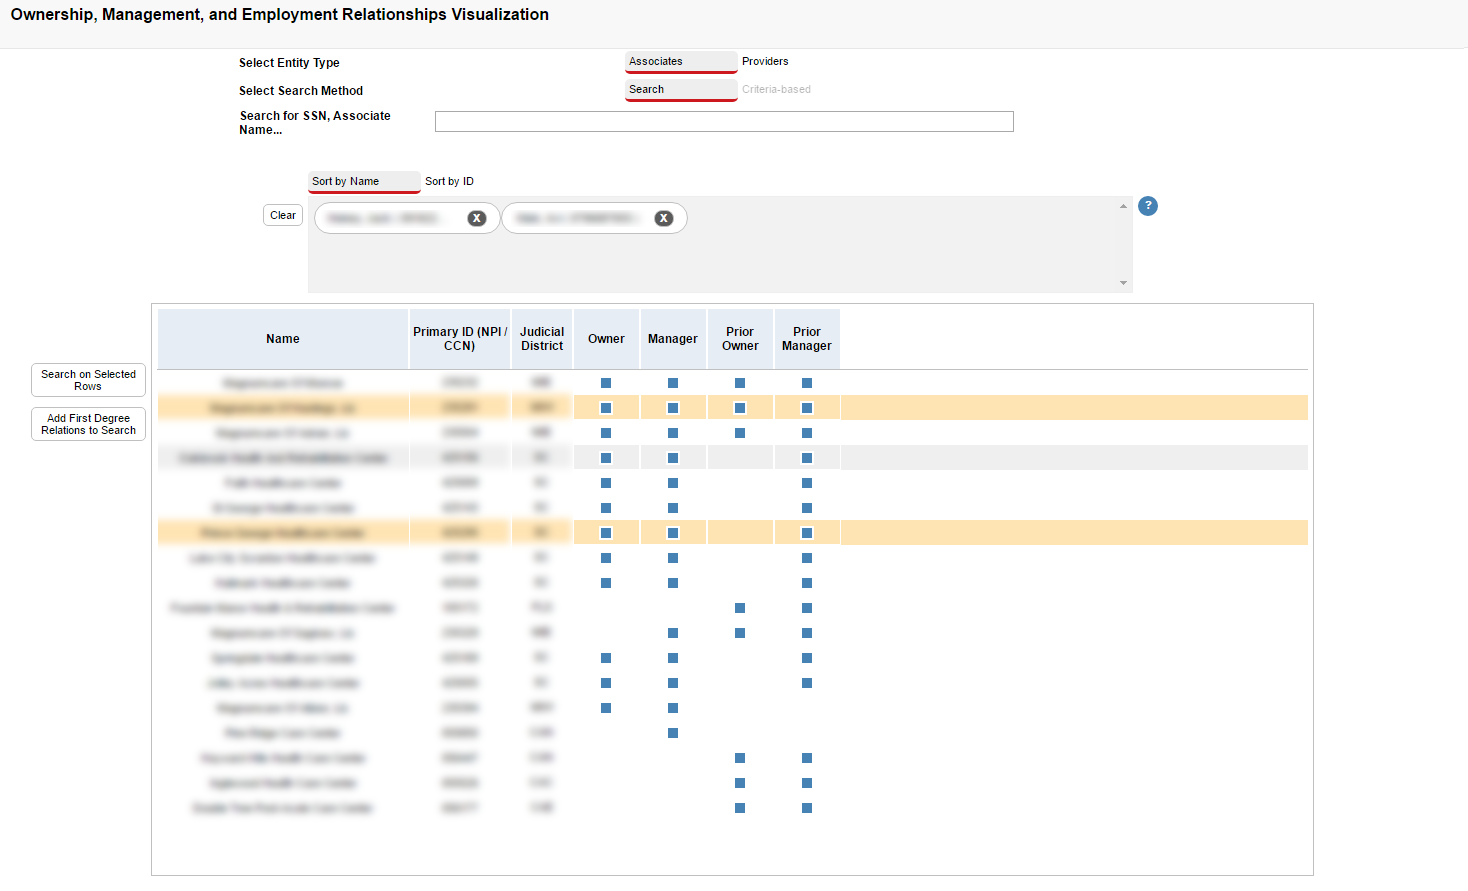
contractual relationship browser
I developed this tool for a client whose requirements were to browse multiple healthcare providers and their associates at once to identify shared contractual relationships. An array of interactive functions is provided to allow the user to build the network being examined and to subset to links with particular characteristics (shared ownership by all currently-searched entities). Unfortunately, due to greater data security for this project, I am unable to publish the functional graphic online.
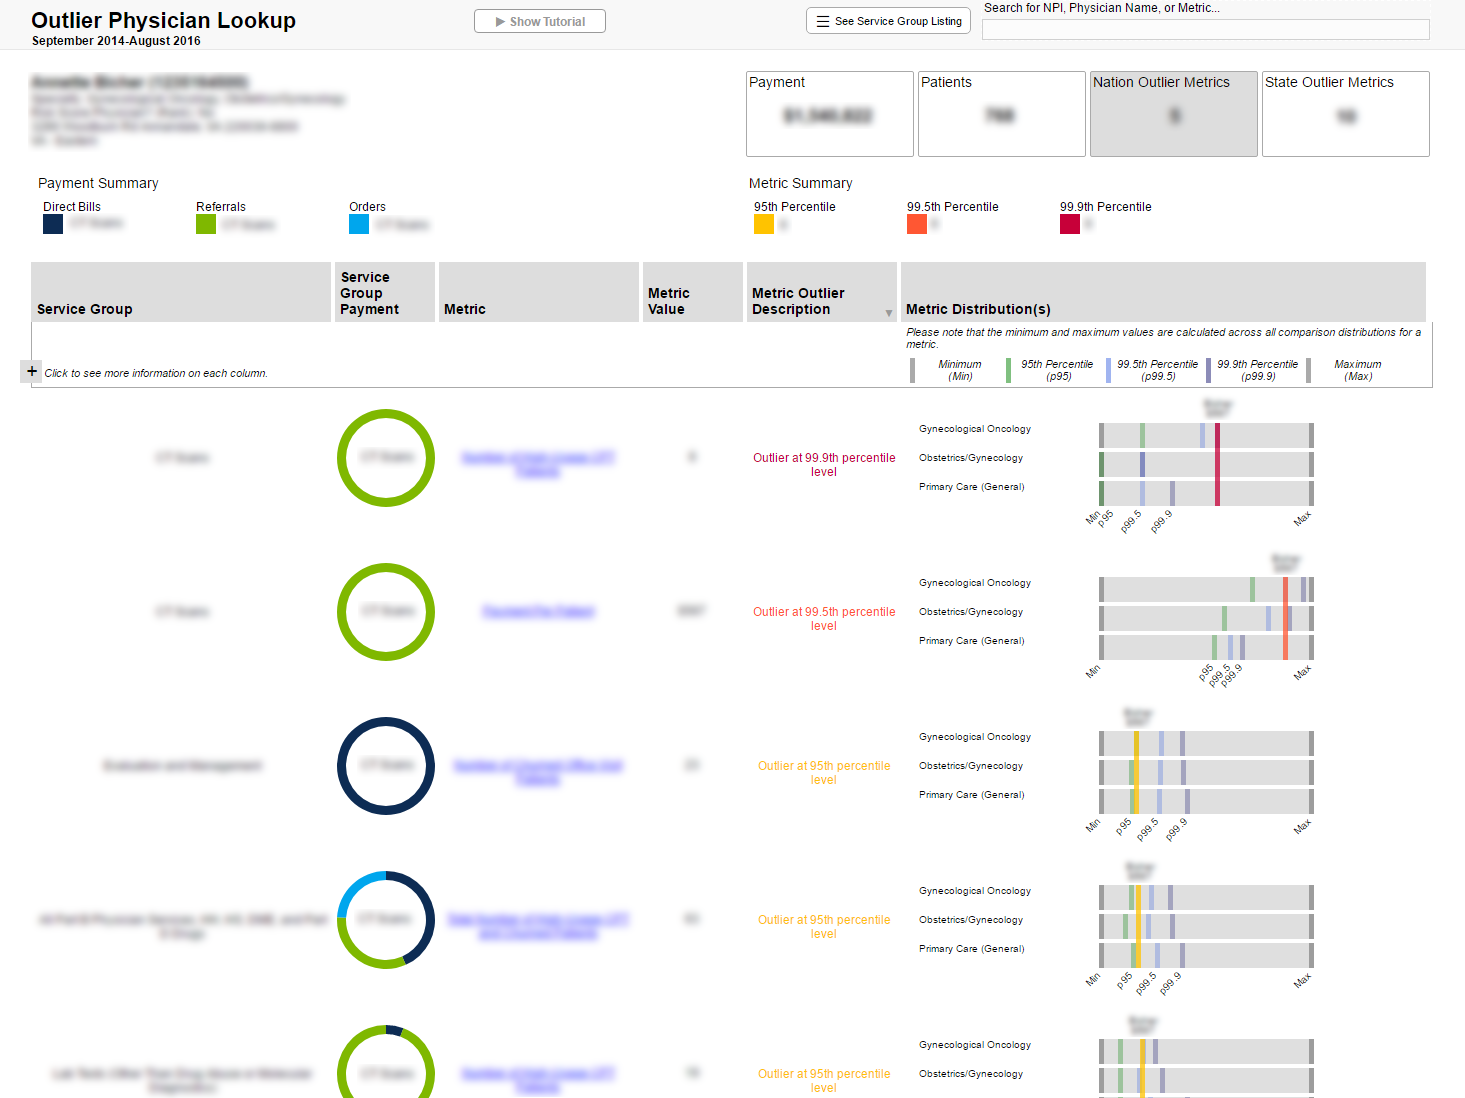
outlier physicians lookup
For this project, my team and I designed an interface that surfaces physicians who are outliers in a wide range of behaviors while providing full detail about the typical behavior of their peer group(s) and their overall utilization. Unfortunately, due to greater data security for this project, I am unable to publish the functional graphic online.
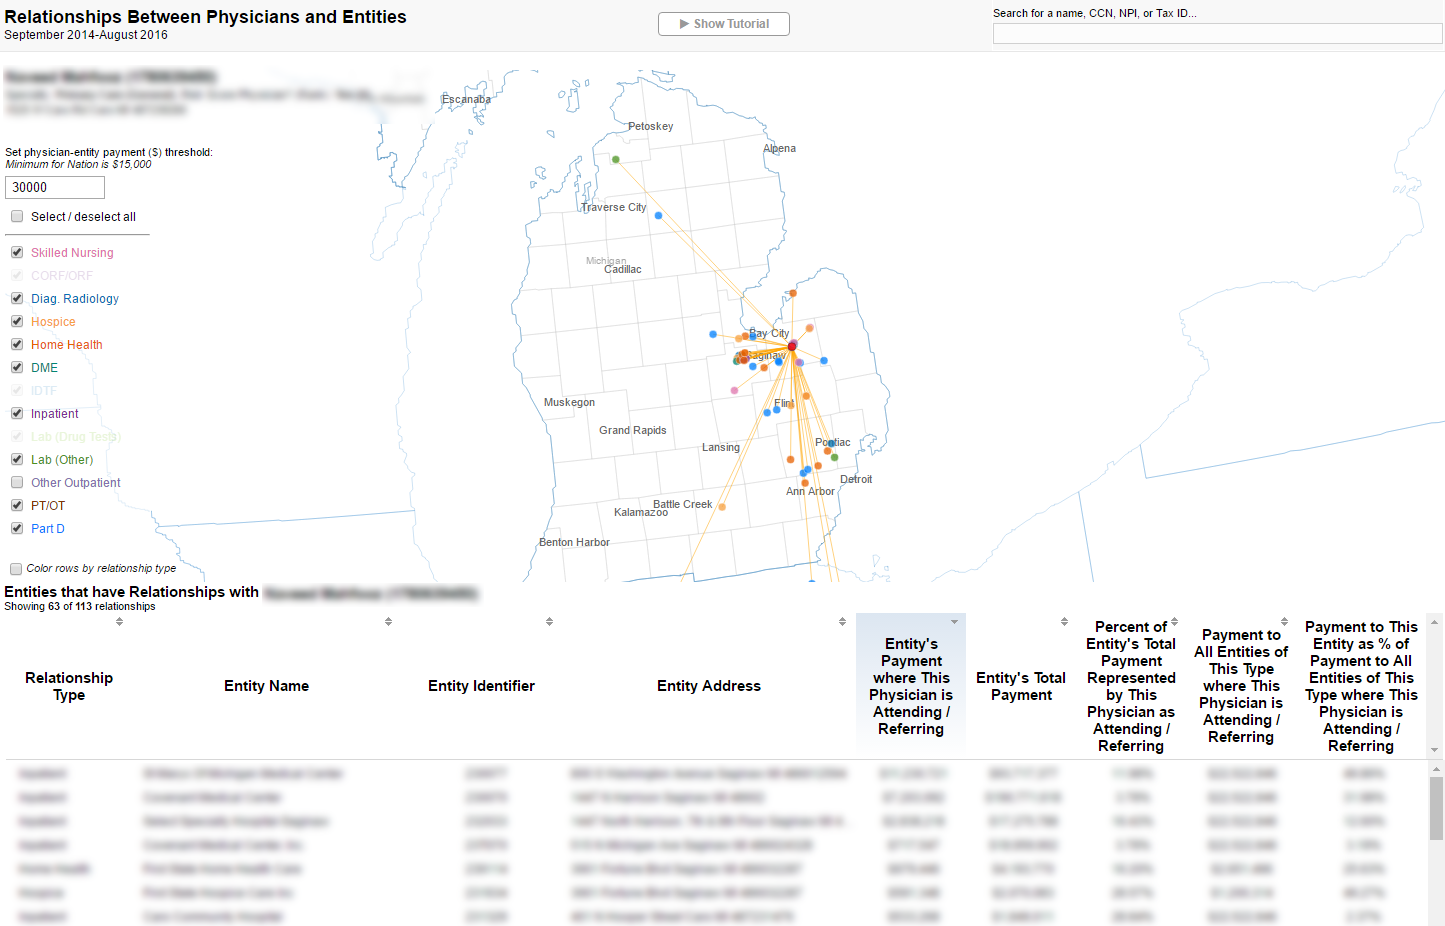
referral networks
For this project, I worked with another analyst to produce a set of re-usable graphic modules -- map generator, tooltip, and table -- and a standard practice for coordinating events and developing new visualizations. The first product from this effort was a graphic examining referral networks. This tool placed physicians geographically with their direct peers while displaying node and link detail in the table. Unfortunately, due to greater data security for this project, I am unable to publish the functional graphic online.
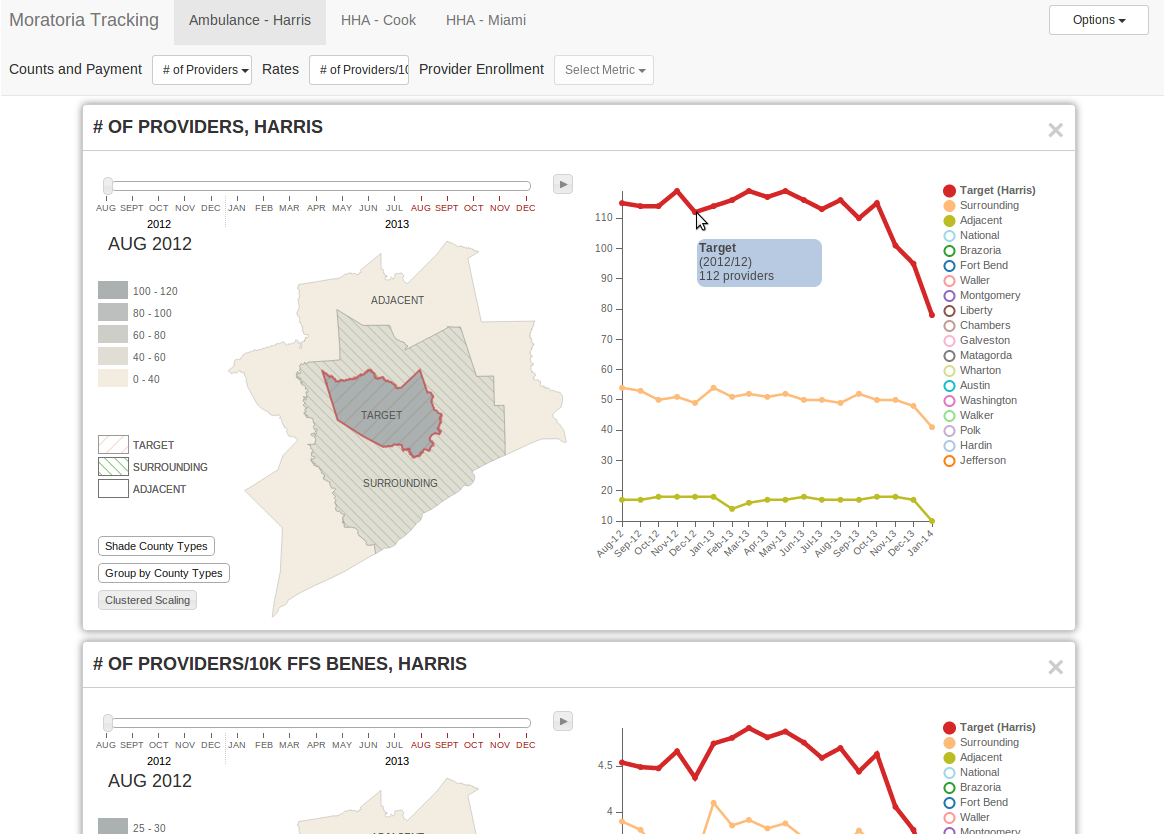
regional monitoring
This was my team's endeavour to build a framework that consolidates visualization of many different, related views of some data. We wanted a simple and flexible dashboard, coded in a way to let charts/graphics be switched out as needed for the specific data/patterns to be communicated. I primarily worked on the map and line charts, which have linked behaviors depending on mouse events, while coordinating with another analyst who developed the layout using Bootstrap. Unfortunately, due to greater data security for this project, I am unable to publish this dashboard online.
distance to county border mapping
This project gave me a chance to roll my own geojson and to figure out the nuances of working with geographic projections and geographic subunits, and to interface with the Google APIs in order to retrieve distance information.
lab testing overutilization tool
The purpose of this project was to create a presentation tool that allows users to sift through a wide array of results, which begin with a broad description of the behavior, to more and more specific instances.
ny times graphic study
One of my favorite interactive graphics of 2013 was the New York Times' examination of the tax rate paid by U.S. companies: Across U.S. Companies, Tax Rates Vary Greatly. The bubble placement along a meaningful dimension, and excellent accompanying annotations (with intuitively-linked tooltips) really did it for me. But I was not at all sure how they performed the bubble placement for this graphic. I know of the treemap layout which can pack rectangles tightly, but how did they pack circles while constraining the x-position? The circle-packing problem into a rectangular region is not trivial, so I wanted to see how I could get an approximation.
Please note that all content (data, annotations) is the property of NY Times; here I am just exploring a way to implement a similar type graphic.
pattern mining, machine learning
standard of care based on frequent itemsets
In this project, I wanted to identify frequently-seen sequences of procedures for patients with certain conditions. This could help to identify established standards of care, starting directly from the data. Such information would be useful to identify suspect providers who deviate from these standards.
classifying physician specialties with topic model
When investigating providers, I had access to their self-reported specialty, but these fields are not always reliable. Specialty information can help to set our expectations about their behavior, and here I set out to determine specialty based on how the provider practices (what procedures they bill, patients they see) rather than the reported value. I investigated here the use of a topic model to generate meaningful specialties (topics).
text field classification of comment text
This project was my first introduction to topic models. I used R's topicmodels package to categorize the freeform "comment" fields in one of Medicare's provider enrollment databases.
tumor detection for CT colonography scans
As a student and for over a year after graduating from the University of Chicago, I worked with Dr. Kenji Suzuki in his Medical Physics / Computer Vision lab developing algorithms for computer-aided detection (CAD) of tumors.
In this time, I learned about several machine learning algorithms, including ANN and SVM, and became especially comfortable thinking about evaluation of models, etc. A major project that I worked on
was the computer-aided detection of flat polyps -- medically difficult cases even for trained radiologists.